Objective workload distribution
Spot overload fast and rebalance with confidence.
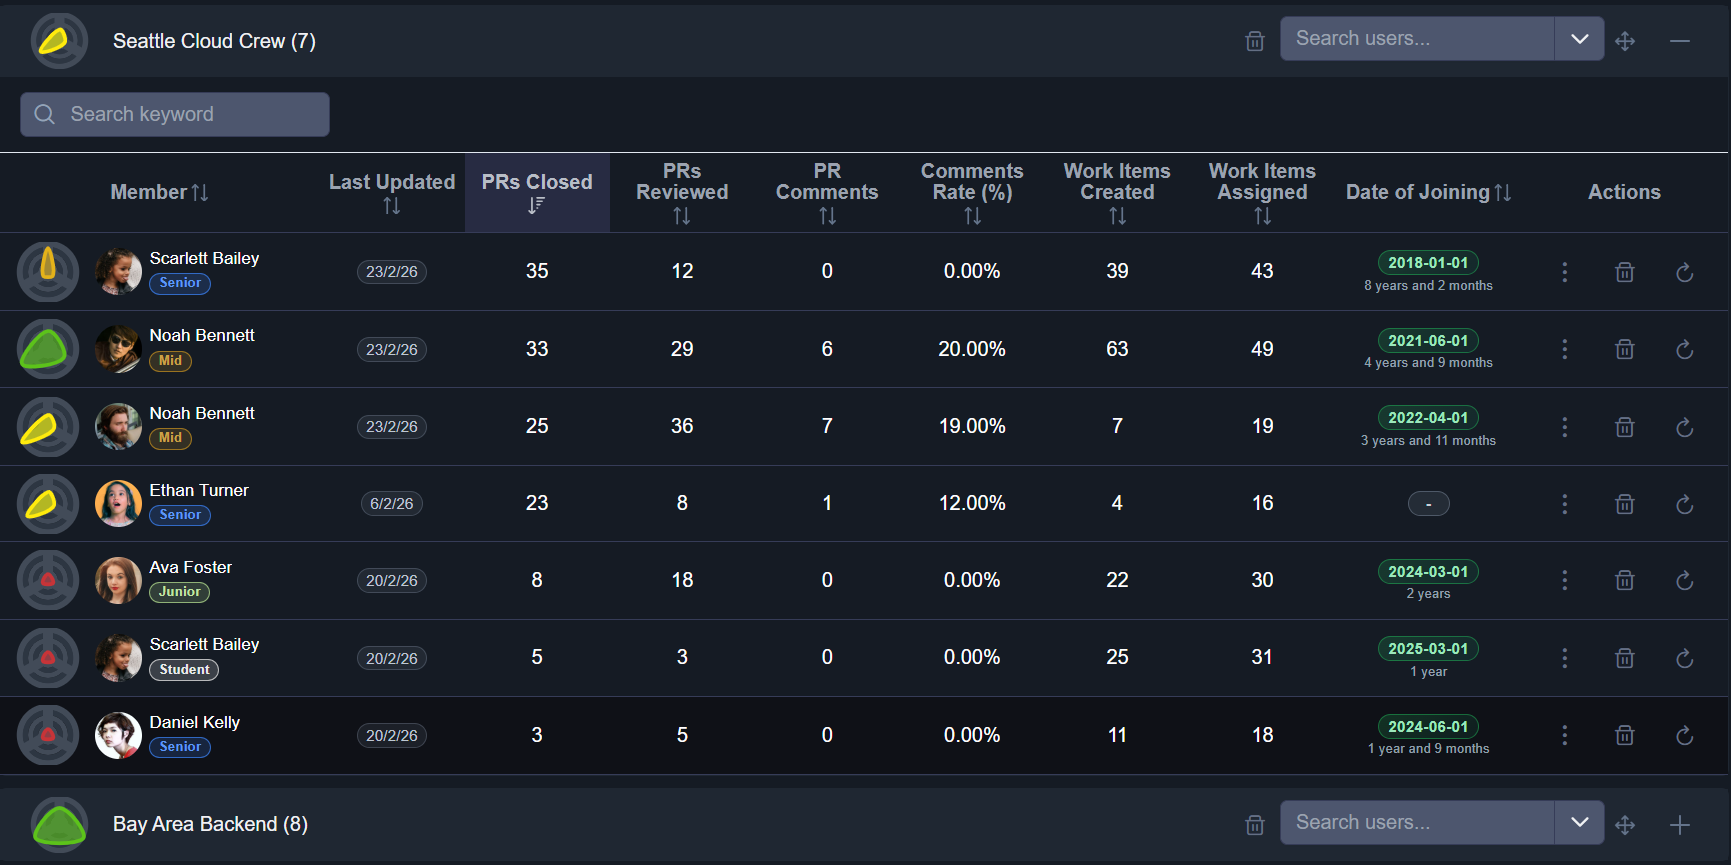
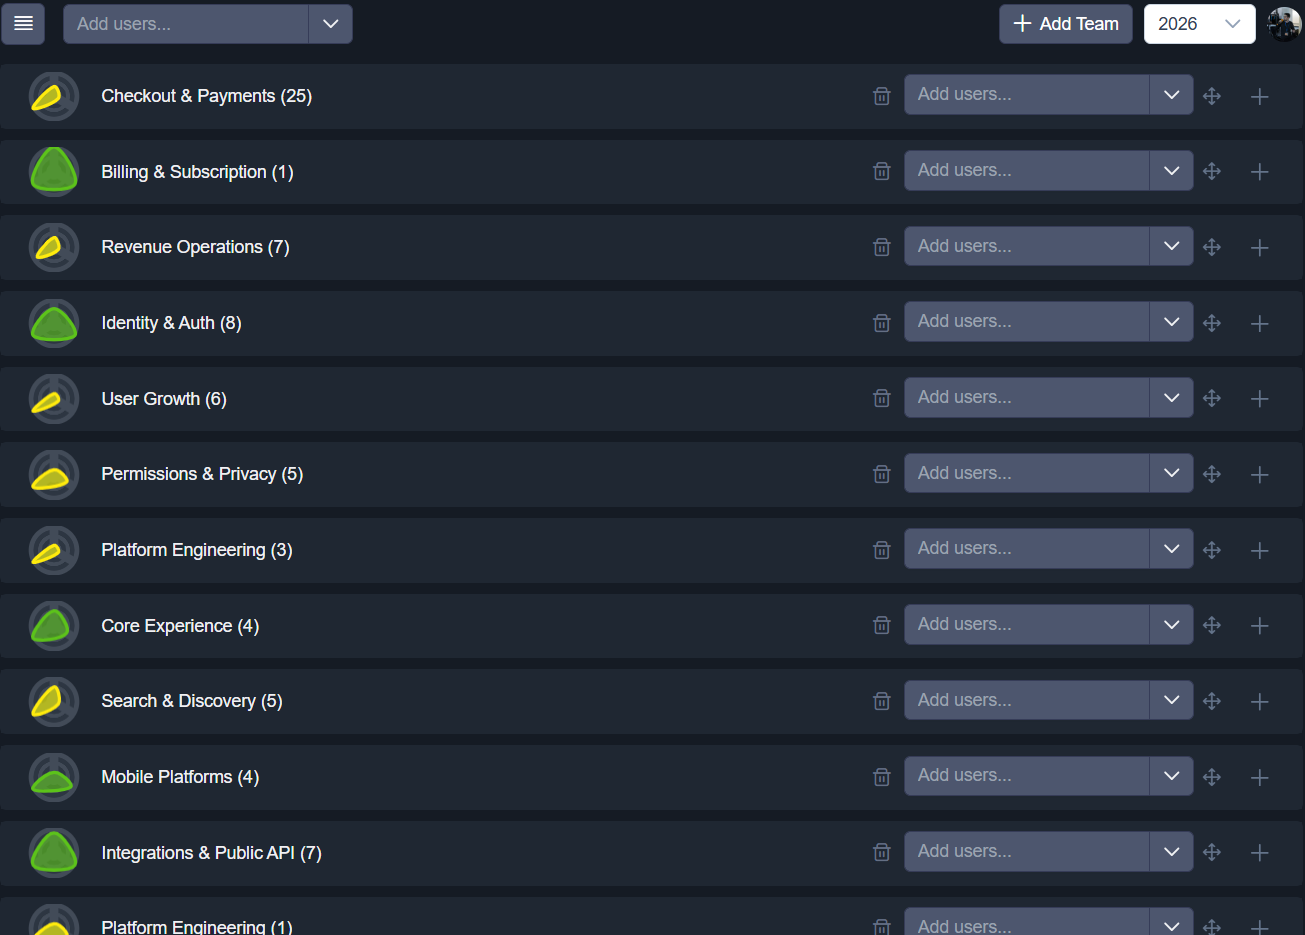
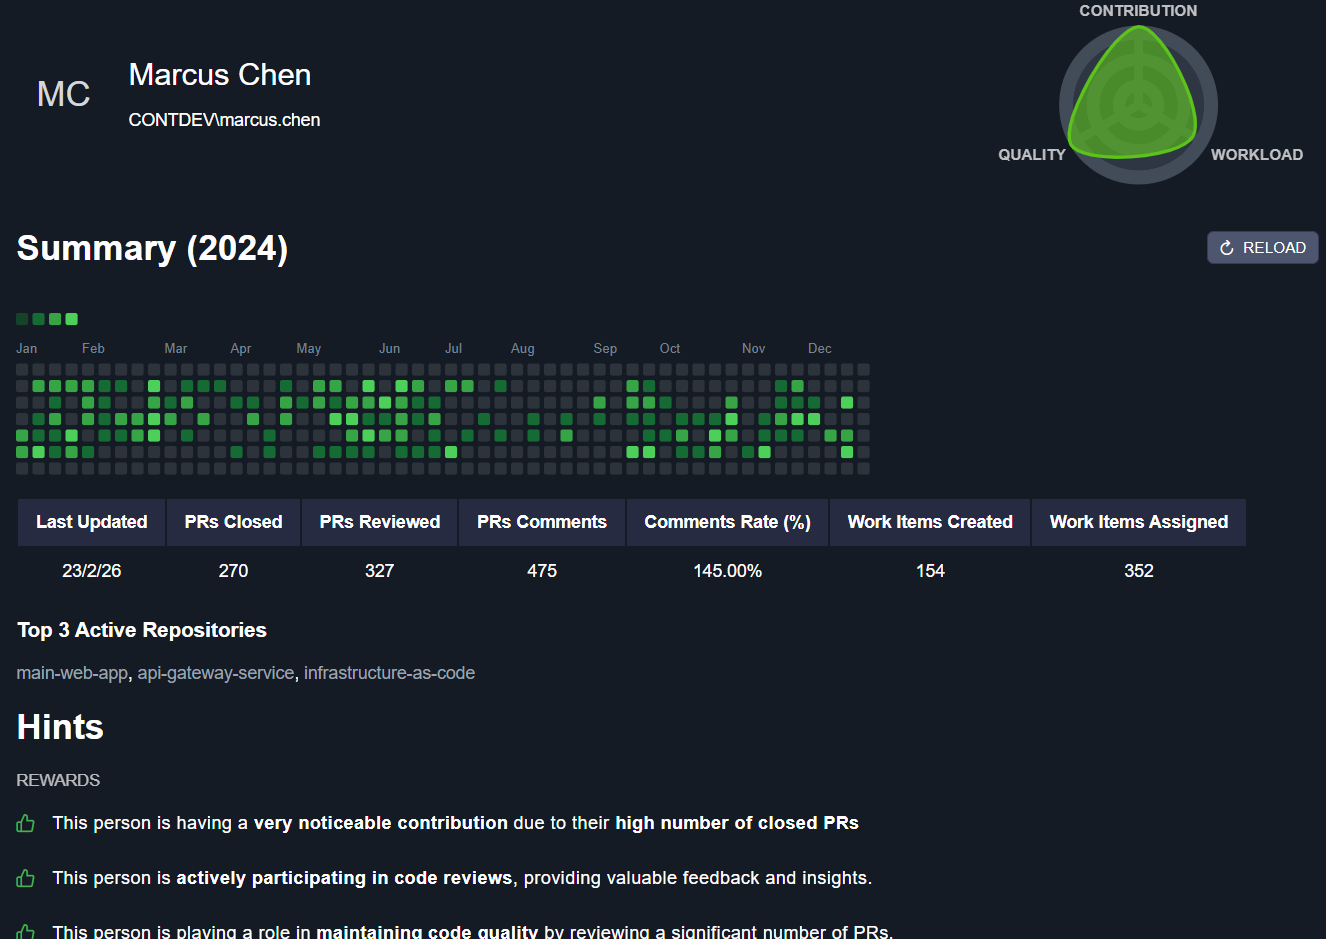
Connect once. See contribution trends by team and developer
For Software Managers, VPs, and CTOs who manage capacity and delivery.
Spot overload fast and rebalance with confidence.
Compare teams in one view and catch bottlenecks early.
Share one live view with CTOs, VPs, and managers.
Drill into team trends and compare contribution patterns using leadership-ready views.
Alpha is live now with Free plan access. Basic and Premium are in rollout and currently available through booked demos.
Essential analytics for a small team
€0/month
Ideal to validate value during your first rollout.
Start Free TrialNo Credit Card RequiredFor growing engineering organizations
€39/month
Available through a guided demo with our team.
Book a DemoUnlimited scale for enterprise teams
€99/month
Available through a guided demo with our team.
Book a DemoShare your details and we will contact you to schedule a demo for your selected plan
Looking for "Contributions Graph Azure DevOps"? This is the modern upgrade.